Detectmulticollinearity
Tabular Data - Data EDA - Correlation - Detect Multicollinearity
Table of Content
How to detect correlation between features?
Correlation is measured between numeric features only.
Starting with calculating the correlation metric between numeric features
corr_matrix = df.select_dtypes('number').corr()
Secondly, visualizing the metric using heatmap
_, ax = plt.subplots(figsize =(10,8))
sns.heatmap(corr_matrix,ax = ax, linewidths = 0.1)
plt.title('Features Correlation')
plt.savefig('../report/plots/correlation.jpg')
plt.show()
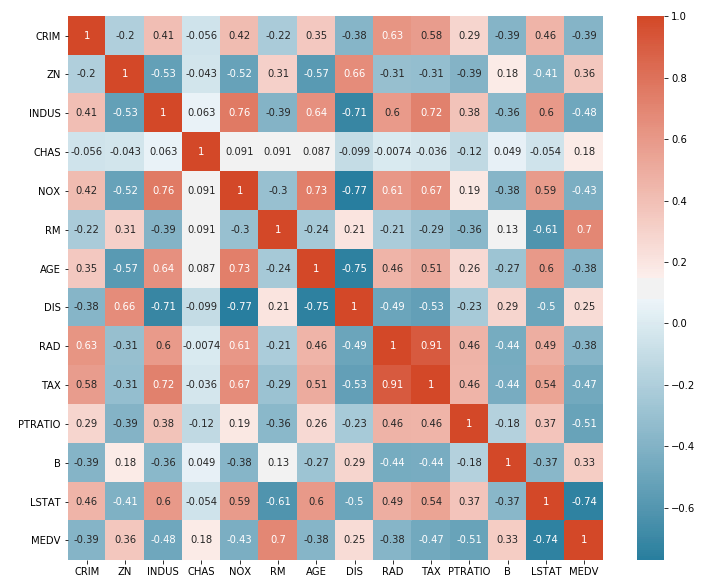
Heatmap is not very easily to be visualized, So for better interpreting, we will jump to third step.
Thirdly, Calculating the correlation between each feature and all the other features.
# Simplify by emptying all the data below the diagonal
# np.tril_indices_from will return the indecies diagonal and below (lower triangle)
tril_index = np.tril_indices_from(corr_matrix)

# Make the unused values NaNs
for coord in zip(*tril_index):
    corr_matrix.iloc[coord[0], coord[1]] = np.NaN

# Stack the data and convert to a dataframe
corr_values = (corr_matrix
              .stack()
              .to_frame()
              .reset_index()
              .rename(columns={'level_0':'feature1',
                                'level_1':'feature2',
                                0:'correlation'}))

# Get the absolute values for sorting
corr_values['abs_correlation'] = corr_values.correlation.abs()
This will output a dataframe, containing each feature and its correlation coefficient with other features.
feature1
feature2
correlation
abs_correlation
f1
f2
-0.52
0.52
f1
f3
0.89
0.89
f2
f3
-0.023
0.023
Fourthly, Ploting a histplot to get an overview of the features correlation.
ax = corr_values.abs_correlation.hist(bins=50, figsize=(12, 8))
ax.set(xlabel='Absolute Correlation', ylabel='Frequency')
Lastly, Check which of the featueres has a correlation above certain threshold like 0.8
corr_values.sort_values('correlation', ascending=False).query('abs_correlation>0.8')